
ServiceNow AI Academy: Predictive Intelligence Classification
Trying to increase the depth of my education on ServiceNow AI, I’ve started watching videos in the AI Academy on Youtube.
This channel has been live for 3 years now and it’s a goldmine.
I can’t find any good excuse, as a ServiceNow architect, at the time we are now, NOT TO to avidly ingest all that content. If my sense of urgency for self-preservation in my job should point me somewhere, that’s the place. I’m glad to know that, though I wish I had this realization earlier.
So every week, I’ll pick one of those videos, watch it carefully, take notes, massage the content and write here what I find most interesting.
I’m doing it for myself first, because I find that is the most effective and lasting way to stick new ideas in my head.
And who knows, this article may surface in your timeline right when you are open for it, and it will lead you to learn something too.
I want to make it clear, the merit 100% goes to the people from ServiceNow who do these videos. In this one, that’s Lener Pacania.
All I merely do is ingest, massage, fill my understanding gaps and render the content from the video. Hoping that some elements will remain in my head along the way.
This week, the video is:
AI Fundamentals Part 1 – Understanding Classification
1. Introduction
Predictive Intelligence (PI) in ServiceNow is a machine learning (ML) capability that can automate classification tasks such as predicting assignment group, category, priority field values – or any field that has a limited set of possible values (think Choice or Reference fields).
This feature leverages historical data to train models (develop a logic). Then, the model uses that same logic to predict/calculate a value on new records. The value you get is statistically most likely based on the inputs.
The idea is easier to understand when applied to understanding:
- I give the computer thousands of pictures of all fruits nature has to offer
- Every picture is labelled with the name of the fruit
- Training over a volume of pictures, the model finds distinctive characteristics/patterns for each fruit: The computer thinks “I’m told it’s called a banana and I notice in most pictures it’s elongated, curved, yellow with black sparkles.”
- The computer creates its own common definition of bananas based on pictures. The definition is stated as a complex equation we – humans – would not even understand.
- When you show a new picture to the machine, it runs its equation and tells you it’s a Banana (x% sure)
In ServiceNow it’s pretty much the same, but instead of pictures, we use text strings, and instead of fruit names we use field values.
2. AI & Machine Learning Context
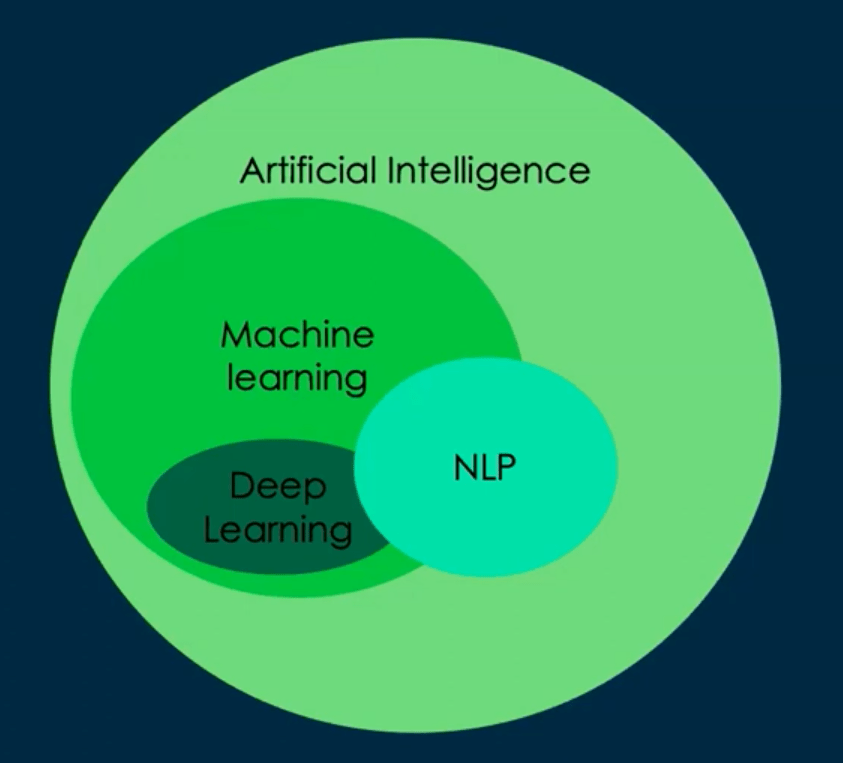
2.1 AI vs Machine Learning vs Deep Learning
Stepping back, let’s review where PI Classification fits in the AI landscape and the technologies at play.
- Artificial Intelligence (AI): Broad domain encompassing ML, deep learning, NLP, computer vision, speech recognition, and generative models.
- Machine Learning (ML): Subset of AI where models learn patterns from data rather than being explicitly programmed.
- This is where PI Classification fits.
- Deep Learning (DL): Specialized ML using multi-layer neural networks for complex pattern recognition.
- Natural Language Processing (NLP): Intersection of ML and DL for understanding human language; used in ServiceNow’s Virtual Agent and NLU-powered search.
2.2 Learning Types
- Supervised Learning: Model trained on labeled historical data (e.g., incidents with known assignment groups, same example as the pictures labelled as bananas above).
- Classification in PI is a supervised.
- Unsupervised Learning: Model discovers patterns without labels (e.g., clustering in Automation Discovery, Similarity).
- Neural Networks: Can perform both supervised and unsupervised learning.
3. PI Classification Overview
The picture below is a bit dated for not mentioning NowAssist (GenAI) Agentic AI and Document intelligence, but it’s not the topic of this article.
Also mote tha, ServiceNow is not promoting the Regression analysis ML capability.

3.1 What ServiceNow PI Classification does
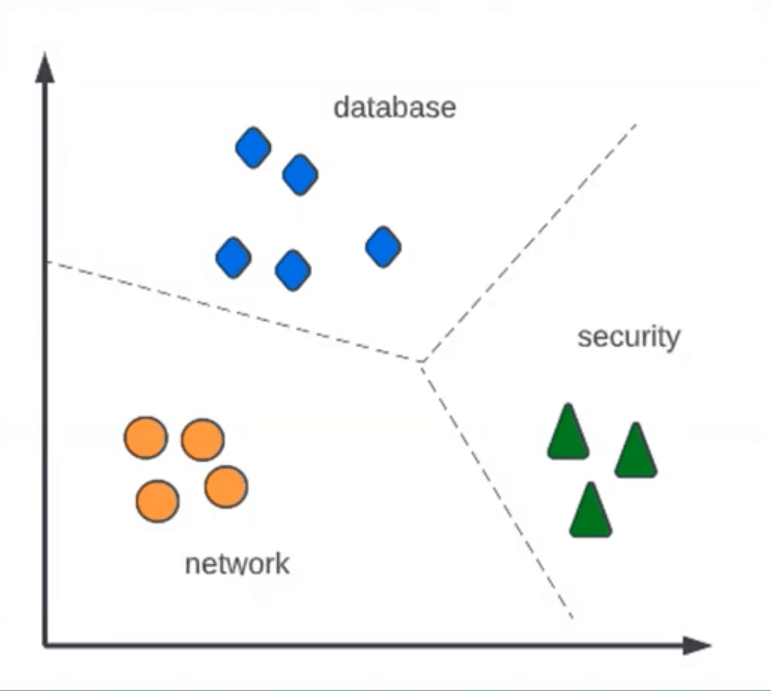
Classification in PI is multi-class classification — given an input record’s attributes (short description, Description), the model predicts which discrete class (field value) it belongs to (e.g., “Database” assignment group vs “Network”).
3.2 Core Algorithms
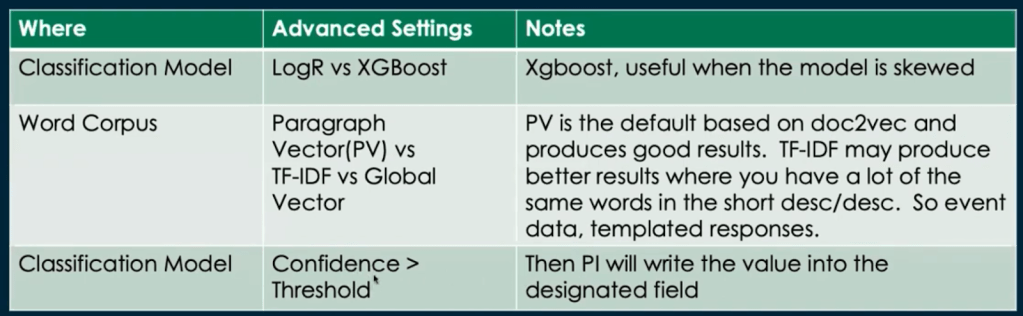
- Default: Logistic Regression — draws decision boundaries between classes.
I didn’t know what Logistic regression was before but it’s not so complex. It’s an algorithm that takes multiple variables as input (think of several fields values in ServiceNow)
And the output is the probability of a binary True/False value. In other words, a value between 0 (unlikely) and 1 (very likely).
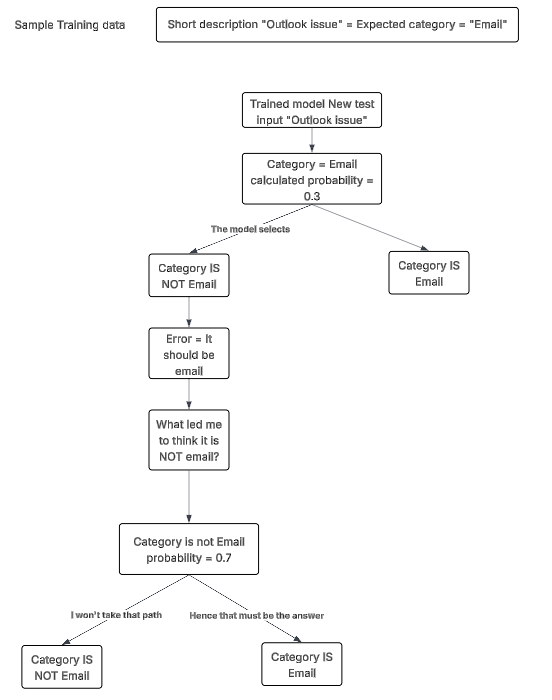
E.g. for the Short description “Unable to access email on Outlook – login page keeps refreshing. There is a 0.8 / 80% chances that the Category is Software > Email.
- Alternative: XGBoost — gradient boosting trees is more effective for imbalanced datasets.
“Gradient boosting trees” is a statistical tool that iterates on prediction errors, in self-correcting decision loops (concept of boosting for pushing forward). Below is a quick diagram of how I understand best.
3.3 OOTB Models
ServiceNow ships classification models to predict:
- Assignment Group
- Category
- Priority
- Change Risk
You can easily create many more use cases.
4. The Four-Step Model Creation Process
In the advanced interface (Predictive Intelligence → Classification → Solution Definitions), the workflow has four main steps:
Step 1 — Select a Word Corpus
A word corpus defines vectorization: converting text fields (e.g., short_description) into numeric vectors for the ML algorithm.
A word about Vectorization
Vectorization transforms unstructured text into n-dimensional numerical arrays. It is a common pre-requisite so ML algorithms can operate and used in other AI technologies
Example:
- Input: “Hello”
- Translated Output: [0.12, -0.43, 0.98, …]
- Vectors encode semantic similarity (e.g., “dog” close to “cat”, but far from “pizza”).
ServiceNow uses vectorization to enable:
- Classification
- Regression

I find this concept of vectorization highly conceptual but fascinating.
The best way I can represent it in my mind is like a galaxy of Celestial objects. There are different kinds of celestial objects randomly scattered in a 3D space.
And imagine that one day, The Master of the Universe decided that it’s definitely too messy and determined to do some clean-up, grouping together objects that are the same, or very close: White dwarf at the bottom right, Black hole at the middle,Planets in the top right, etc.
And a vector is not an object in the galaxy, but rather a constellation of objects (Cassiopeia W shaped). It only becomes meaningful when we connect the dots.
I realize it’s an oversimplification. I’ll deep dive into it in another article.
Vectorization options:
- Paragraph Vector (Doc2Vec) (default) — preserves semantic relationships between words.
- TF-IDF — better for repetitive/templated data (e.g., machine-generated event descriptions).
- GloVe (Global Vectors) — useful for industry-specific terminology.
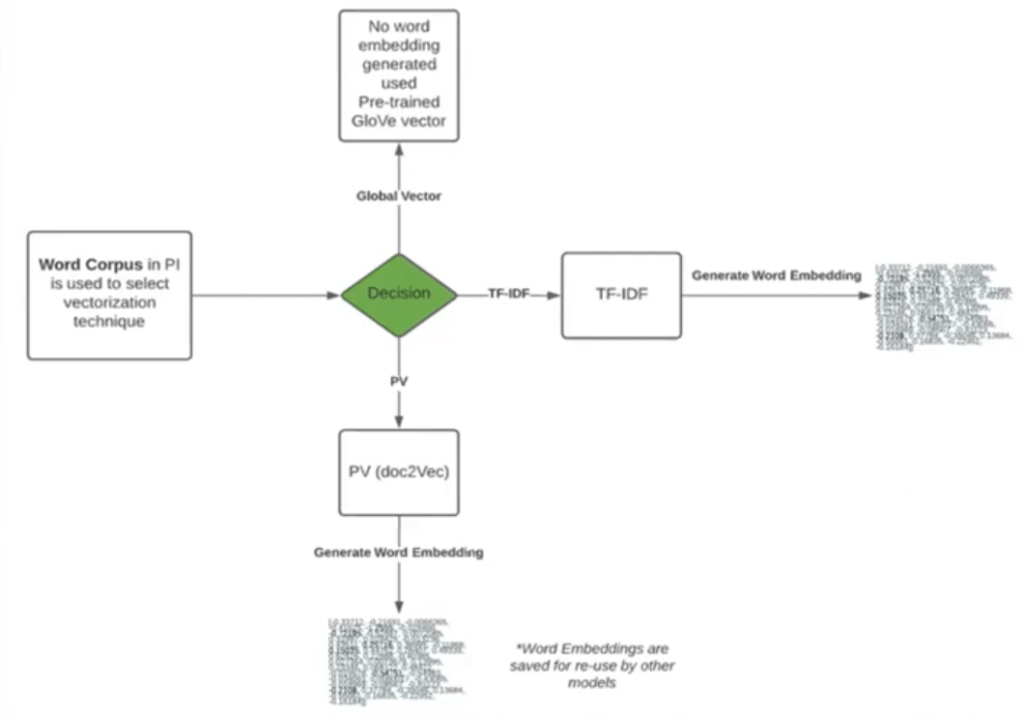
Best practice: Start with default; experiment only if model performance needs improvement.
Step 2 — Define Output Field
The target field to predict (e.g., assignment_group).
Key checks before selecting:
- Avoid data imbalance (e.g. 80% of the training data has “Network” as target assignment group).
- Ensure no nulls, no language mixing, and no abnormal characters.
If imbalanced data, consider:
- Adding correlated input fields (e.g., Location to supplement short_description).
- Splitting into multiple models.
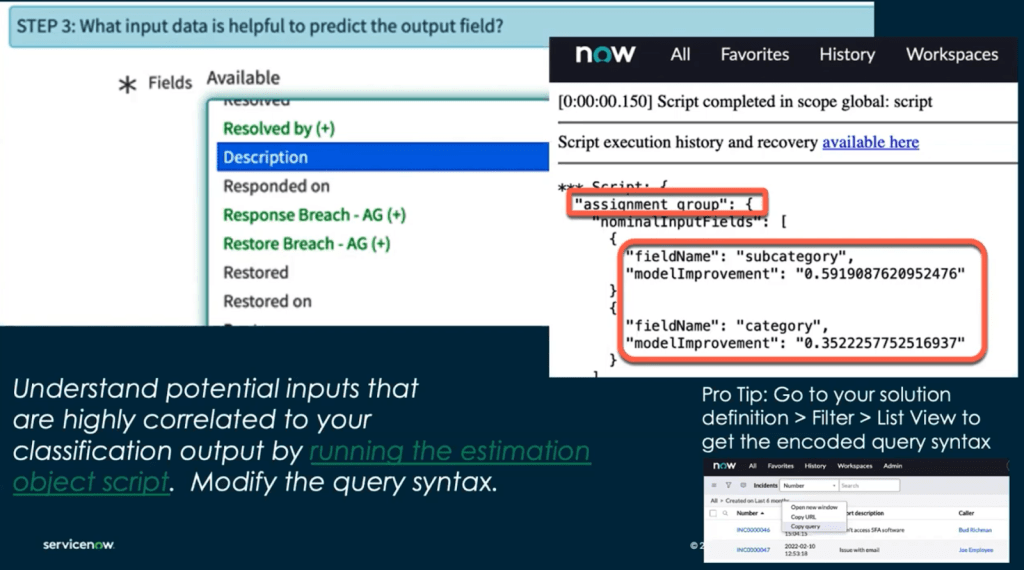
Step 3 — Select Input Fields
Choose fields that are predictive of the target.
Recommendations:
- Correlation analysis scripts to identify which fields improve the model.
- Avoid low-density fields (many nulls), preferably mandatory fields.
- Separate machine-generated data from human-entered data into distinct models.
Step 4 — Filter Training Data
Define criteria to:
- Limit dataset to 30k–50k rows for faster training. For real it can work with as few as 10k records.
- Ensure data is recent, clean, and relevant.
- PI will split data into 80% training / 20% testing sets automatically.
6. Model Performance Metrics
Once trained, PI reports:
- Precision: % of predicted values that are correct. Higher precision may lead to more false negative
- Recall: % of actual target values correctly identified. Higher recall may lead to more false positive
- Coverage: % of records for which the model can make a confident prediction.
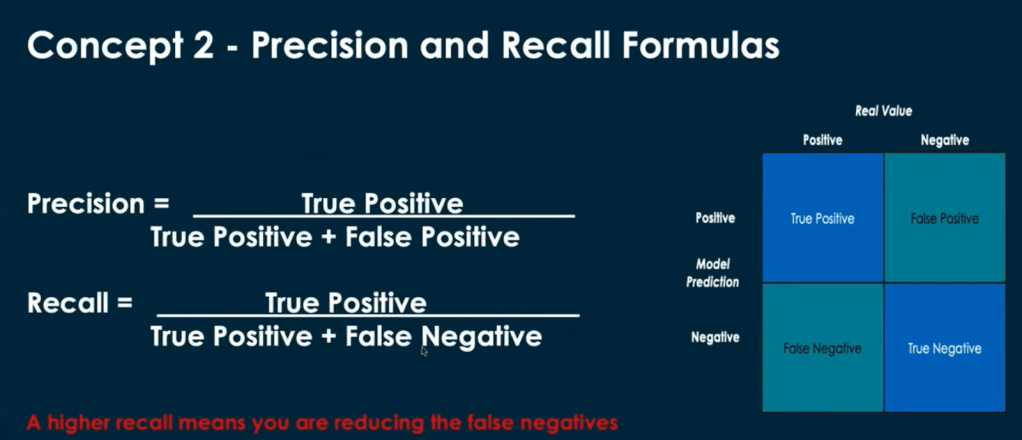
6.1 Precision–Recall Trade-off
- Increasing precision usually decreases recall and vice versa.
Higher precision may lead to more false negative but all Positive will be true
Higher recall may lead to more false positive but there will be also more True positives
It is a trade-off that engineers who tune Monitoring solutions are familiar with. What is the right balance between reducing the noise of non-meaningful events and the risk of missing a critical one.
- Adjust per business context:
- High Recall for critical scenarios (e.g., security incident detection).
- High Precision for costly misclassifications.
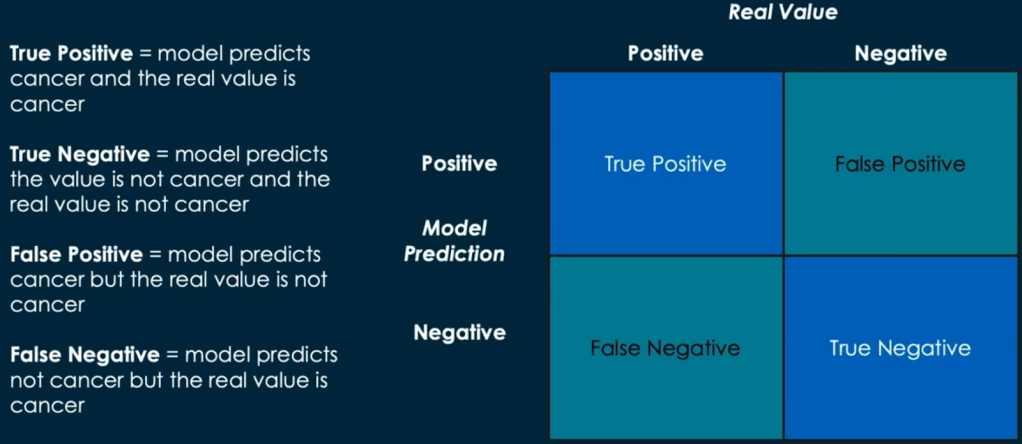
6.2 Confusion Matrix
Breakdown of:
- True Positives (TP)
- True Negatives (TN)
- False Positives (FP)
- False Negatives (FN)
Example:
For cancer detection, FN (missed positives) is most dangerous → aim for high recall.
7. Handling Data Limitations
If data volume or quality is poor:
- Start with hybrid routing:
- Use ML where confidence ≥ a defined threshold (e.g., 0.7).
- Fall back to traditional assignment rules otherwise.
- Improve training data iteratively to expand ML coverage.
8. Model Deployment Options
- JavaScript API (ML API)
- Full control; callable from Business Rules, UI Actions, etc.
- Requires scripting.
- Flow Designer Spoke
- No-code integration in workflows.
- PI Workbench Guided Setup
- Simplified creation and deployment with limited control.
9. Best Practices Summary
- Clean & Balance Data before training.
- Correlate Inputs to Outputs — don’t select fields blindly.
- Limit Skewed Distributions — split into multiple models if needed.
- Vectorization Defaults First, then experiment.
- Monitor Model Stats and iterate (precision, recall, coverage).
- Deploy Gradually, with fallbacks.
- Track Business Impact — measure coverage × cost-per-ticket saved.
10. Key Takeaways for Architects
- PI Classification is not “set-and-forget” — data engineering and iterative tuning are crucial.
- Understanding vectorization and data distribution directly impacts accuracy.
- Architectural decisions (single vs multiple models, deployment method) affect maintainability and scalability.
- Always balance ML automation with human oversight until confidence levels are proven in production.
11. Use case first.
PI Classification is just another tool to achieve something. It’s not because PI classification can do it, that it’s the only way to do it.
Even if we receive pressure from CXO level to use AI everywhere because it sounds cool and modern, it’s not always the most pragmatic way to achieve the outcome.
E.g. to set the Assignment group, there are plenty more ways to automate that with predefined prescriptive rules, on which you’ll have better control. Most of the time those will be sufficient.
As we’ve seen there is a significant effort to curate the training data and tune the PI model to make it work. And it’s not a one time exercise.
It’s always wise to think of the opportunity cost, and wonder what I would do with all that time and capacity if I didn’t implement the use case with PI?
If you can come up with prescriptive rules that work 100% of the time, I’d suggest you go for it.
You may also consider the maintenance effort. If the prescriptive script or rules you have to set up are so large and complex (because there are so many exceptions) that it’s not understandable by the next consultant or maintainable, then PI may do a better job over the long run.
References:


Leave a comment